This article is an on-site version of our Energy Source newsletter. Sign up here to get the newsletter sent straight to your inbox every Tuesday and Thursday
Hello and welcome back to Energy Source. Amanda Chu here, writing to you today about the state of US clean-tech manufacturing.
Over the weekend, Oliver Roeder and I reported that pledges by companies to produce clean tech and semiconductors surpassed $200bn in the US since President Joe Biden approved historic subsidies in August, almost double the investments committed to the same sectors in 2021.
The surge in investment suggests Biden’s industrial policies are having an effect on the market and reflects a larger trend away from globalisation as countries prioritise national security over cheap prices. In Energy Source today, we dig deeper into how the US clean-tech supply chain is shaping up.
Also in today’s newsletter, Derek reports on the latest US enforcement push on the Russian oil price cap. In Data Drill, Justin dives into Germany’s farewell to nuclear.
Thanks for reading. — Amanda
Tracking the impact of the US Inflation Reduction Act
It’s been eight months since the US president approved historic legislation to ensure the country’s energy transition would be fuelled by domestic manufacturers.
The Inflation Reduction Act included at least $369bn in subsidies to reorient clean tech supply chains towards the US and away from China. Overnight, the bill transformed the US into one of the most attractive markets for clean tech — much to the chagrin of European allies who fear its subsidies will diminish the continent’s manufacturing base.
At least $65bn in clean-tech manufacturing investments and 44,000 jobs have been announced in the US since the IRA’s passage, twice the investment commitments in 2021, according to new Financial Times analysis.
The FT looked at clean tech manufacturing announcements of at least $100mn based on company and government press releases, as well as data from fDi Markets and Rystad Energy.
Here are three central points from our analysis:
1. Red states and districts are winning
Clean-tech investments are overwhelmingly flowing into Republican-led districts, despite the fact that the bill had no GOP support in Congress. More than 80 per cent of all clean-tech investment pledges are headed to Republican-led congressional districts, according to the FT’s analysis.
South Carolina, Georgia and Alabama are among the top five states in clean-tech project announcements since the IRA’s passage, accounting for 40 per cent of all projects.

Among these investments is Norwegian Freyr’s $2.57bn lithium-ion battery plant in Georgia. While the state’s Republican governor Brian Kemp has been a vocal opponent of the IRA, Freyr’s executives cited the bill’s incentives as a crucial reason for accelerating their entry into the US.
“We decided to accelerate our site selection process. We pushed it up in part because we want to play fast into this IRA window,” said Tom Einar Jensen, chief executive of Freyr, adding that the IRA presents “the strongest incentive programme” for battery production in the world.
Analysts say the overwhelming flow of projects into Republican districts could spark a shift in the party’s stance on clean energy and presents a challenge to Democrats over whether they can adequately communicate to voters and take credit for these investments.
2. European investments are a small portion of overall share
For months, the IRA has sparked a trade row between the US and central allies, particularly in Europe, who accused America of protectionism.
European commission president Ursula von der Leyen has warned that the IRA could create “unfair competition” and could “close markets” unless actions are taken to counter the bill. The trade tensions have sparked the EU to unleash its own subsidy provisions to protect projects from going abroad.
Our analysis, however, found that European investment makes up only a small share of US clean-tech manufacturing pledges since the IRA’s passage, roughly 12 per cent.
Among the largest foreign investors are South Korea and Japan, whose companies have committed more than $30bn in building out the US electric vehicle and battery supply chain since August. Last month, LG Energy Solution announced a $5.5bn battery plant in Arizona, the largest battery investment to date in the US.

3. More investment (and incentives) to come
The flurry of clean-tech announcements is far from over — nearly $13bn in pledges were made last month alone. More investments are expected as the Treasury provides more clarity into how the IRA tax credits will be implemented.
Interstate competition to secure the next billion-dollar investment is fierce. Of the 57 projects we tracked, about two dozen publicly disclosed incentive packages, totalling $6.7bn in state and local subsidies.
Last Friday, Oklahoma governor Kevin Stitt announced the state had entered the largest economic development contract in its history for a $696mn incentive package signed into law at the start of March. Stitt didn’t name the company, but Panasonic — which last year also agreed to build a $4bn battery plant in Kansas — has been in negotiations with Oklahoma.

One caveat to remember amid this flurry of announcements is that these pledges aren’t binding and may not actually result in factories and jobs on the ground. A handful of companies are proposing projects that have never been demonstrated at scale.
“You’re going to see investors being highly selective in which of those projects that have been announced are going to get finance,” said David Scaysbrook, co-founder of investment manager Quinbrook Infrastructure Partners, when I spoke with him last month about the US hydrogen economy.
Needless to say, we will be watching closely to see which projects get developed. (Amanda Chu)
The US is tightening enforcement of the Russian price cap
The goal of G7’s Russian price cap plan was to crimp Moscow’s oil export revenue while ensuring barrels kept flowing to the market. So far, it has worked:
-
Russian oil exports in March stood at 8.1mn barrels a day, their highest level since April 2020, the International Energy Agency said last week.
-
Oil revenue rose to $12.7bn in March, up significantly from February, but remains about 43 per cent lower than a year ago, the agency said.

But is trouble afoot?
While Urals, Russia’s main export grade of crude oil, has traded below the $60 a barrel cap for the first three months of the year, some news agency calculations now say that the surprise Opec+ cuts have pushed the price of seaborne Urals above the threshold. If so, this would make shippers taking the oil ineligible for western insurance and services.
Crude shipped through Russia’s Eastern Siberia–Pacific Ocean pipeline to the far eastern port of Kozmino, meanwhile, has traded well above the cap for months. All told, the IEA believes the weighted average price for all Russian crude “beat the $60 a barrel starting 5 April”, with ESPO up to as much as $74 a barrel.
That’s fine, provided shippers trading the ESPO oil out of Kozmino at such prices are not using western insurance. But as my colleagues Tom Wilson and David Sheppard showed a few weeks ago, that conclusion is not obvious.
Ofac, the arm of the Treasury Department in charge of sanctions, now seems concerned about the kind of trading described in the FT piece.
“Ofac is aware of reports that ESPO and other crudes exported via Pacific ports in the Russian Federation, such as Kozmino, may be trading above the price cap and may be using covered services provided by US persons,” it said in an alert issued yesterday.
In bold lettering, the alert noted that US companies and people providing covered services should reject and report any transaction that violates the price cap.
Traders have said US policing of the price cap has been almost non-existent in recent months. But Ofac’s alert suggests that phase may be over.
“An enforcement push now appears to be under way,” said analysts at Washington’s ClearView Energy Partners. They noted that US officials had also travelled to central Europe and Central Asia for “anticircumvention efforts in tandem with European allies”. (Derek Brower)
Data Drill
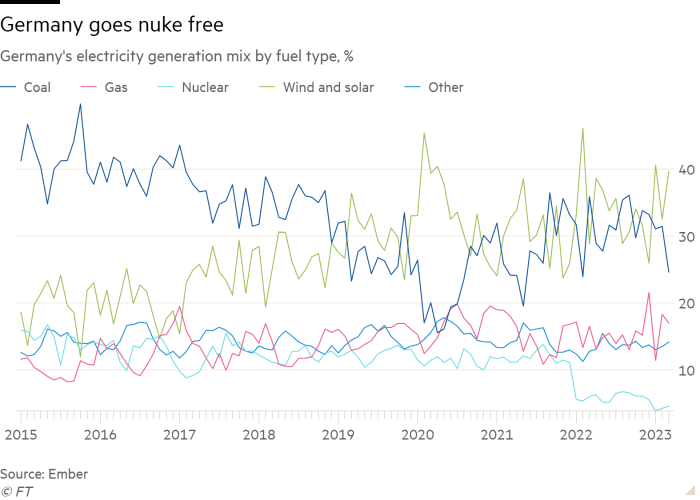
The lights went out at Germany’s three remaining nuclear power plants over the weekend, ending a long goodbye for the nation’s nuclear industry.
The politics that ultimately killed the sector are complex, but from a climate perspective the end of emissions-free nuclear power in the country is a clear loss.
The victim of the decades long anti-nuclear campaign is a power grid that runs primarily on a combination of coal and renewables, which accounts for roughly 70 per cent of Germany’s power generation, as today’s chart shows.
It’s not hard to imagine a different sort of grid for Europe’s most important economy had it continued to invest in nuclear power. Surging wind and solar generation could have all but killed off coal by now if nuclear capacity had been maintained around 2011 levels, when 17 reactors provided roughly a quarter of Germany’s power.
Anti-nuclear activists argue those reactors posed an unacceptable safety risk. But closing them is coming at a high carbon cost.
A renewables-based power grid is still likely to take out coal eventually, but without atomic power that task is proving much dirtier, more difficult and costly. (Justin Jacobs)
Power Points
-
Teck Resources signals top investor backs split as it battles $23bn Glencore bid
-
Swiss-owned company’s Russian gold trades expose gap in western sanctions
-
Rising costs and competition threaten US boom in LNG projects
Energy Source is written and edited by Derek Brower, Myles McCormick, Justin Jacobs, Amanda Chu and Emily Goldberg. Reach us at energy.source@ft.com and follow us on Twitter at @FTEnergy. Catch up on past editions of the newsletter here.
Recommended newsletters for you
Moral Money — Our unmissable newsletter on socially responsible business, sustainable finance and more. Sign up here
The Climate Graphic: Explained — Understanding the most important climate data of the week. Sign up here


