Stay informed with free updates
Simply sign up to the Residential property myFT Digest — delivered directly to your inbox.
Cool chart:

It’s from the data-science desk at Barclays and is in effect a gentrification gauge.
The measure is the Zillow Home Value Index, a weighted average of typical home dollar values across all regions nationwide. What’s shown is the value distribution: as more areas become expensive relative to the median, the density plot gets squashed in the middle and moves further to the right.
This next chart is less cool but also interesting. It divides US housing into five quantiles to show that the areas where values have increased fastest were already the most expensive ones:

There are probably two interconnected effects here. The first is that a decade of cheap mortgage deals gradually flattened the curve, because small changes in monthly repayment costs have ratcheted into ever-higher sales prices. The second is that rising mortgage rates now discourage homeowners with cheap deals to sell, causing undersupply.
The picture’s the same for the two biggest US housing markets, New York state and California.
Here’s New York’s price distribution by area, which is most notable for the disappearing second peak. That’s because values in hipster-infected areas like Ithaca, Albany, Kingston, and Hudson have increased almost five-fold in recent years, so have caught up with NYC:

California still shows two humps but — because of value inflation in popular, moderately affluent areas like San Diego — they’ve flattened dramatically:

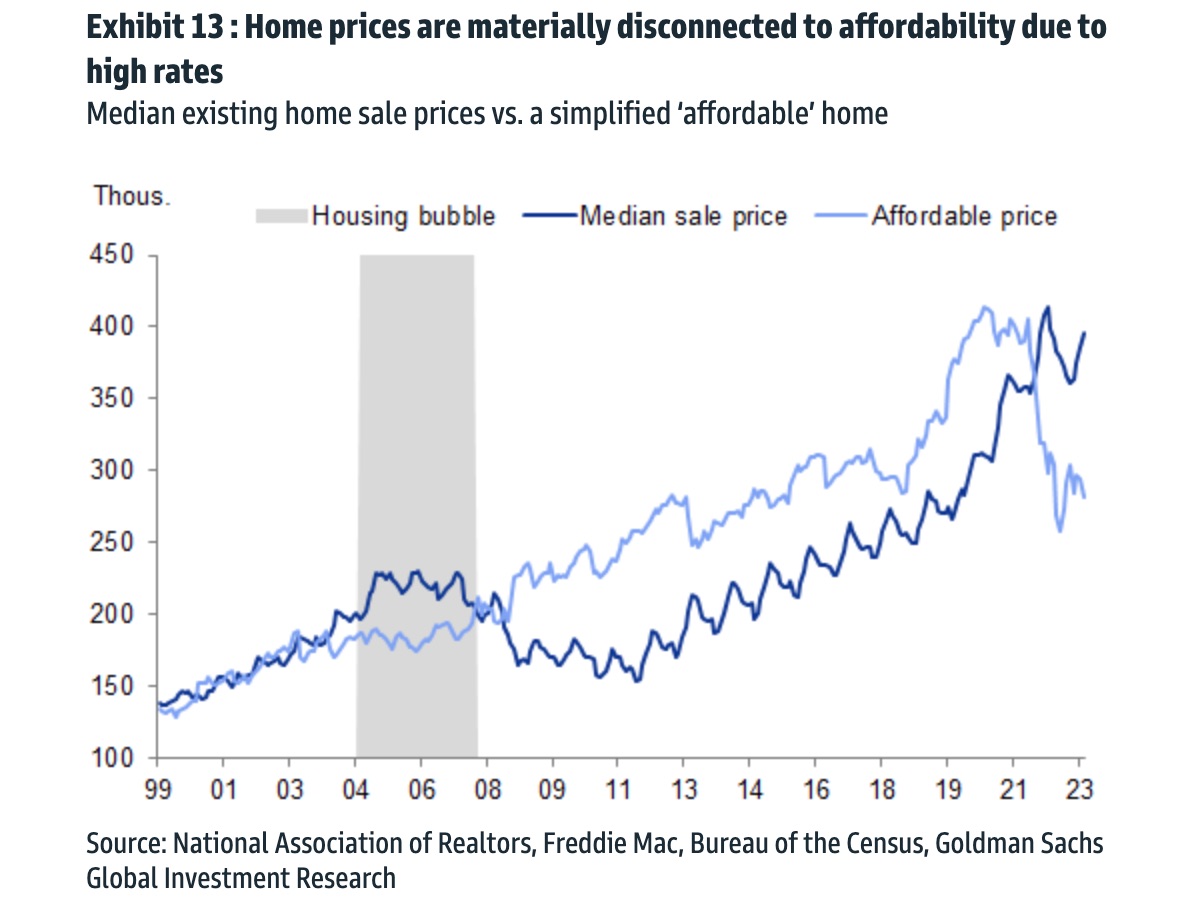
As we’ve discussed often on these pixels, US housing is insulated from higher interest rates by the popularity/availability of non-portable multi-decade mortgages. Valuations may be stretched to levels far above the 2002-2006 bubble but affordability only matters when people move house, and right now they’re staying put:

There’s the added insulation of baby boomers. Families are atomised over time by separation, divorce and death, so while an aging population may (may!) need smaller housing units it rarely results in fewer housing units.
America’s boomer generation will all have retired by the end of the decade and are living alone in increasing numbers. They’re what’s driving new household formation, which will tend to outpace US housing starts:

How does sprawling gentrification fit into this picture? When the boomers eventually need to sell, will they discover that their equity isn’t as valuable as indicated by the independent coffee shop on the corner and the FT journalist across the street? With mid-market availability squeezed, where will they all go?
And if long-term mortgages are the US shock absorber, what might happen in a housing market that has similar demographics but is systemically undersupplied and even more geographically lopsided, and has nearly half its mortage debt rolling off fixed rates by the end of next year? The UK, for example?

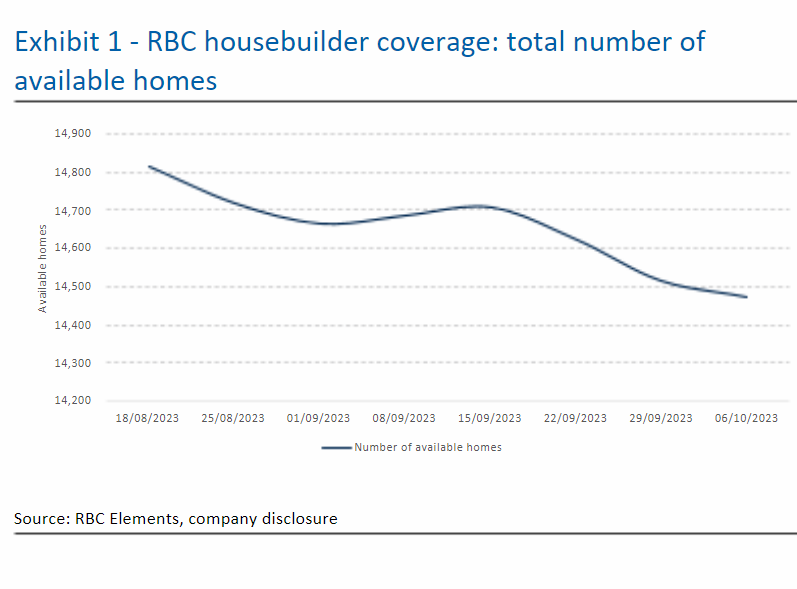
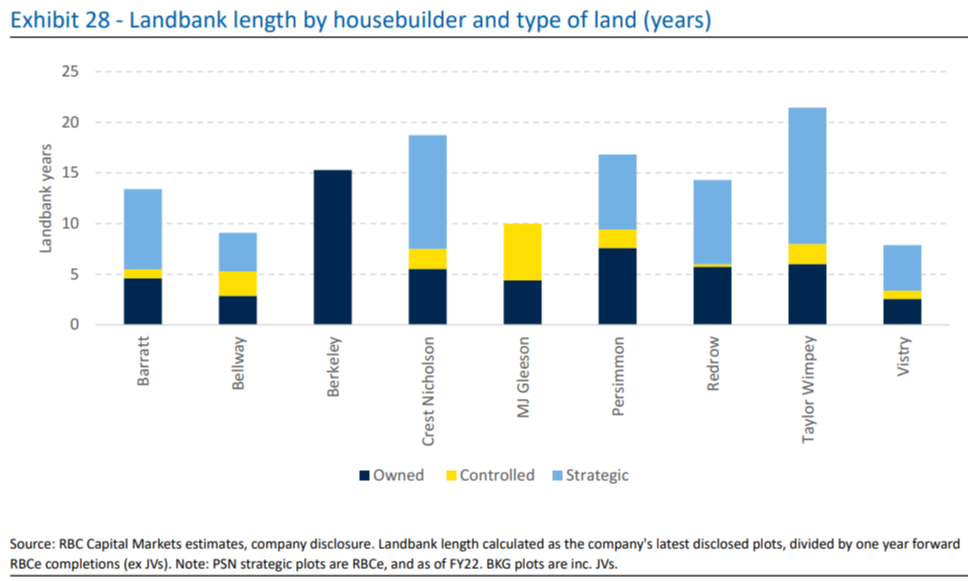
Nothing, apparently. About one in three new UK houses are built by the same nine companies, which — having been choking off supply and mothballing landbank to protect selling prices — now await a pre-election bribe from a government that once promised 300,000 net new homes in England by the mid-2020s (last year’s total: 177,810), all in order to defend Land Registry annualised average house price inflation that was 0.2 per cent in August.
So that’s nice.
Further reading
— Millennials and boomers are competing for homes. Guess who’s winning? (FTAV)


